
NOTE: The Growth Economics Blog has moved sites. Click here to find this post at the new site.
I’ve been trying to think more about why consumption-sector TFP flatlined from about 1980 forward. What I mentioned in the last post about this was that the fact that TFP was constant does not imply that technology was constant.
I then speculated that technology in the service sector may not have changed much over the last 30 years, partly explaining the lack of consumption productivity growth. By a lack of change, I mean that the service sector has not found a way to produce more services for a given supply of inputs, and/or produced the same amount of service with a decreasing supply of inputs. Take something that is close to a pure service – a back massage. A one-hour back massage in 1980 is almost identical to a one-hour back massage in 2014. You don’t get twice (or any other multiple) of the massage in 2014 that you got in 1980. And even if the therapist was capable of reducing back tension in 30 minutes rather than 60, you bought a 60-minute massage.
We often buy time when we buy services, not things. And it isn’t so much time as it is attention. And it is very hard to innovate such that you can provide the same amount of attention with fewer inputs (i.e. workers). Because for many services you very specifically want the attention of a specific person for a specific amount of time (the massage). You’d complain to the manager if the therapist tried to massage someone else at the same appointment.
So we don’t have to be surprised that even technology in services may not rise much over 30 years. But there were obviously technological changes in the service sector. As several people brought up to me, inventory management and logistics were dramatically changed by IT. This allows a service firm to operate “leaner”, with a smaller stock of inventory.
But this kind of technological progress need not show up as “technological change” in doing productivity accounting. That is, what we call “technology” when we do productivity accounting is not the only kind of technology there is. The “technology” in productivity accounting is only the ability to produce more goods using the same inputs, and/or produce the same goods using fewer inputs. It doesn’t capture things like a change in the shape of the production function itself, say a shift to using fewer intermediate goods as part of production.
Let’s say a firm has a production function of 


If innovation changes the shape of the production function, rather than the level, then our TFP calculations could go anywhere. Here’s an example. Let’s say that in 1980 production is 
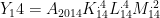
Total factor productivity in 1980 is calculated as
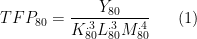
and total factor productivity in 2014 is calculated as

TFP in 2014 relative to 1980 (the growth in TFP) is

which is an unholy mess. The first fraction is TFP in 2014 calculated using the 1980 function. The second fraction is the reciprocal of TFP in 1980, calculated normally. So the first two fractions capture the relative TFP in 2014 to 1980, holding constant the 1980 production function. The last fraction represents the adjustment we have to make because the production function changed.
That last term could literally be anything. Less than one, more than one, more than 100, less than 0.0001. If
Once the production function changes shape, then comparing TFP levels across time becomes nearly impossible. So in that sense TFP could definitely be “getting it wrong” when measuring service-sector productivity. You’ve got an apples to oranges problem. So if we think that IT innovation really changed the nature of the service-sector production function – meaning that 

If you’d like, this supports David Beckworth‘s notion that consumption TFP “doesn’t pass the smell test”. We’ve got this intuition that the service sector has changed appreciably over the last 30 years, but it doesn’t show up in the TFP measurements. That could be due to this apples to oranges issue, and in fact consumption TFP doesn’t reflect accurately the innovations that occurred.
To an ambitious graduate student: document changes in the revenue shares of intermediates in consumption and/or services over time. Correct TFP calculations for these changes, or at least provide some notion of the size of that fudge factor in the above equation.

My thought, when I read the original post (but, alas, did not comment, is that in retail we have seem some examples of technological change which should lead to higher measured productivity.
The first–gas stations, which have moved quite quickly to pay-at-the-pump. This followed an earlier change in technology (pump-it-yourself) that allowed gas stations to substitute customer labor for employee labor.
And, in grocery stores, the adoption of (a technology similar to pay-at-the-pump), self-checkout (again substituting customer labor for employees. One of the grocery stores at which I shop frequently has 4 self-checkout stations and 6 (potentially) employee-staffed stations. At this point, it’s rare to see more than 2 of them actually in operation…
I suspect there’s an entire line of research that could be developed by looking at the substitution of customer labor for employees (self-fill soft drinks in fast food establishments…)
Whether this all actually reflects increased productivity, it should show up in the ways in which we measure productivity–customer labor does not count.
Thats a really good example of tech change that does/should get picked up in TFP. Its probably just not enough of a boost to show up in aggregate service sector stats.
Good insight. Making the customer do more of the work doesn’t seem to be getting captured in the economics statistics.
There’s also the matter of things like more reliable cars requiring less service at gas stations. At one time cars needed new oil every 1,000 (or was it 500) miles. Now it’s 7,500 or more. Falling clothing prices have eliminated tailors and seamstresses who do repair work. Fast food restaurants have eliminated waiters and waitresses. Wheeled luggage and backpacks have eliminated “red caps” at airports. Wash and wear clothes have eliminated ironing. Word processors have eliminated secretaries.
I guess I’m old enough now to recognize how many things like this have changed, and in one particular direction.
One way to put your remark is that we are really good at eliminating intermediate labor- the people who get the priduct from producer to you. And that need not show up as higher TFP.
The process of technological development, divides the world population to those who drive these changes and those who are replaced by it. The gap in income between these two groups widens. Since more and more are those who are becoming non-relevant in the production process, and are unemployed. This causes decrease on the aggregate demand. Because of the social security system in the western world this trend is less obvious compared to the underdeveloped countries, mainly in Africa and in the Muslim world. It seems the “Arab Spring”, revolution is the result of this development.
Except that by your logic no one would be employed at all. All the horse-carriage drivers were put out of work years ago, and yet they and their kids found work. It’s not true that “jobs” just disappear in the long run.
But, in the short run, they do. And those short run disruptions can be traumatic, for sure. Question is whether innovation occurs so fast that short-run disruptions cause so much chaos that they overwhelm the long-run gains.
I would say that when we buy services, we often buy experiences, not outcomes. As Baumol put it, 200 years since Beethoven and it still takes four musicians to play a string quartet.
Taking this a bit further, we Americans are very good at inventing ways to pass the time: movies, TV, video games, theme parks, Facebook. We should have kept reducing work hours, so that people would have the time to enjoy them all. Maybe that’s where the missing demand went? Maybe it’s essential, when transitioning to a service economy, to expand leisure time to consume ‘experience’ services?
Ken – I think that’s exactly right. You can’t generate *measurable* gains in productivity from a lot of services (as in your string quartet example). That doesn’t mean we aren’t getting welfare gains, we’re just not getting GDP gains.
Pingback: Greek structural reforms and TFP growth | Economy View