Why Did Consumption TFP Stagnate?

NOTE: The Growth Economics Blog has moved sites. Click here to find this post at the new site.

I’ve been trying to think more about why consumption-sector TFP flatlined from about 1980 forward. What I mentioned in the last post about this was that the fact that TFP was constant does not imply that technology was constant.

I then speculated that technology in the service sector may not have changed much over the last 30 years, partly explaining the lack of consumption productivity growth. By a lack of change, I mean that the service sector has not found a way to produce more services for a given supply of inputs, and/or produced the same amount of service with a decreasing supply of inputs. Take something that is close to a pure service – a back massage. A one-hour back massage in 1980 is almost identical to a one-hour back massage in 2014. You don’t get twice (or any other multiple) of the massage in 2014 that you got in 1980. And even if the therapist was capable of reducing back tension in 30 minutes rather than 60, you bought a 60-minute massage.

We often buy time when we buy services, not things. And it isn’t so much time as it is attention. And it is very hard to innovate such that you can provide the same amount of attention with fewer inputs (i.e. workers). Because for many services you very specifically want the attention of a specific person for a specific amount of time (the massage). You’d complain to the manager if the therapist tried to massage someone else at the same appointment.

So we don’t have to be surprised that even technology in services may not rise much over 30 years. But there were obviously technological changes in the service sector. As several people brought up to me, inventory management and logistics were dramatically changed by IT. This allows a service firm to operate “leaner”, with a smaller stock of inventory.

But this kind of technological progress need not show up as “technological change” in doing productivity accounting. That is, what we call “technology” when we do productivity accounting is not the only kind of technology there is. The “technology” in productivity accounting is only the ability to produce more goods using the same inputs, and/or produce the same goods using fewer inputs. It doesn’t capture things like a change in the shape of the production function itself, say a shift to using fewer intermediate goods as part of production.

Let’s say a firm has a production function of {Y = AK^{\alpha}L^{\beta}M^{\gamma}} where {A} is technology in the productivity sense, {K} is capital, {L} is labor, and {M} is intermediate goods. Productivity accounting could reveal to us a change in {A}. But what if an innovation in inventory management/logistics means that {\gamma} changes?

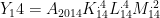
If innovation changes the shape of the production function, rather than the level, then our TFP calculations could go anywhere. Here’s an example. Let’s say that in 1980 production is {Y_80 = A_{1980}K_{80}^{.3}L_{80}^{.3}M_{80}^{.4}}. Innovation in logistics and inventory management makes the production function in 2014 {Y_14 = A_{2014}K_{14}^{.4}L_{14}^{.4}M_{14}^{.2}}.

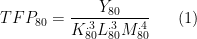
Total factor productivity in 1980 is calculated as

\displaystyle  TFP_{80} = \frac{Y_{80}}{K_{80}^{.3}L_{80}^{.3}M_{80}^{.4}} \ \ \ \ \ (1)

and total factor productivity in 2014 is calculated as

\displaystyle  TFP_{14} = \frac{Y_{14}}{K_{14}^{.4}L_{14}^{.4}M_{14}^{.2}}. \ \ \ \ \ (2)

TFP in 2014 relative to 1980 (the growth in TFP) is

\displaystyle  \frac{TFP_{14}}{TFP_{80}} = \frac{Y_{14}}{K_{14}^{.3}L_{14}^{.3}M_{14}^{.4}} \times \frac{K_{80}^{.3}L_{80}^{.3}M_{80}^{.4}}{Y_{80}} \times \frac{M_{14}^{.2}}{K_{14}^{.1}L_{14}^{.1}} \ \ \ \ \ (3)

which is an unholy mess. The first fraction is TFP in 2014 calculated using the 1980 function. The second fraction is the reciprocal of TFP in 1980, calculated normally. So the first two fractions capture the relative TFP in 2014 to 1980, holding constant the 1980 production function. The last fraction represents the adjustment we have to make because the production function changed.

That last term could literally be anything. Less than one, more than one, more than 100, less than 0.0001. If {K} and {L} rose by a lot while {M} didn’t go up much, this will lower TFP in 2014 relative to 1980. It all depends on the actual units used. If I decide to measure {M} in thousands of units rather than hundreds of units, I just made TFP in 2014 go down by a factor of 4 relative to 1980.

Once the production function changes shape, then comparing TFP levels across time becomes nearly impossible. So in that sense TFP could definitely be “getting it wrong” when measuring service-sector productivity. You’ve got an apples to oranges problem. So if we think that IT innovation really changed the nature of the service-sector production function – meaning that {\alpha}, {\beta}, and/or {\gamma} changed, then TFP isn’t necessarily going to be able to pick that up. It could well be that this looks like flat or even shrinking TFP in the data.

If you’d like, this supports David Beckworth‘s notion that consumption TFP “doesn’t pass the smell test”. We’ve got this intuition that the service sector has changed appreciably over the last 30 years, but it doesn’t show up in the TFP measurements. That could be due to this apples to oranges issue, and in fact consumption TFP doesn’t reflect accurately the innovations that occurred.

To an ambitious graduate student: document changes in the revenue shares of intermediates in consumption and/or services over time. Correct TFP calculations for these changes, or at least provide some notion of the size of that fudge factor in the above equation.

I Love the Smell of TFP in the Morning

NOTE: The Growth Economics Blog has moved sites. Click here to find this post at the new site.

Very recently John Fernald of the SF Fed released a quarterly series on total factor productivity (TFP) in the US. One of the neat things about his series is that you can look separately at investment (equipment and consumer durables) and consumption (everything else). When you plot these out, you see a really big divergence.

Fernald 2014 TFP

(Note: My graph from Fernald’s data).

Consumption TFP essentially flat-lines from about 1980 until today. At the same time, investment TFP races ahead. Aggregate TFP is a weighted average of the two, and since investment is only about 20% of total spending, this means aggregate TFP exhibits a slight rise (Each series is normalized to 100 in 1947, so you cannot compare absolute levels across sectors like this).

The flat-line in consumption TFP has generated a few puzzled reactions. David Beckworth in particular said that the consumption series “does not pass the smell test”. He says that Fernald’s measure (and by implication other TFP calculations) must be flawed, and wants a better way to measure productivity.

This is an overreaction, and represents a misunderstanding of what TFP is, and what it measures. The first thing that often happens is that people confuse “labor productivity” with “TFP”. Labor productivity depends on TFP and on other factors of production, like capital. So labor productivity could be rising in the consumption sector even if TFP is not.

But leaving that possible misunderstanding aside, let’s think more carefully about what goes into TFP. As a rough guide, when we measure changes in TFP what we get is the following

Chg. TFP = Chg. Technology + Chg. Utilization + Markups x Chg. Inputs

You can be more technical about things, but this is roughly what you’ll get. What are those three parts?

  • Technology. This is what it sounds like – the ability to produce real goods/services with a given stock of real inputs. If technology improves, this will add to our measure of TFP.
  • Utilization. If the economy, or the sector we are talking about, is using their capital or labor more intensely, then this will show up as increased utilization, and will also pass through to higher TFP. For the given stock of inputs (workers or number of machines) you are getting more output.
  • Markups x Inputs. This term is a tricky one. If you charge price markups over marginal cost, then this is equivalent to saying that you do not produce as much as socially optimal (where P = MC). So if we increase inputs in your sector, this raises output, and gets us closer to the socially optimal point. So when markups exist, higher input use will translate to higher TFP.

The problem that plagues Beckworth and many others is that they are trying to exactly equate TFP with “technology”. That just isn’t the case. Technology can be improving in the consumption goods sector, but this could be offset by changes in utilization, markups, or input use. Flat-lining TFP doesn’t imply that there were no gains in technology.

So what could be going on with utilization and markups/inputs? If you dig through Fernald’s data, you can find that utilization in the consumption sector has fallen over time. The consumption sector uses factors about 97% as intensely as it did in the 1960s. That shows up as lower TFP.

An additional factor that would play into consumption TFP staying flat would be market power, and here I think Beckworth gets it right that whatever is going on in consumption is because of services. The service sector tends to have really low markups over marginal cost. Additionally – and I have nothing but some intuition to back this up – I think innovation in the service sector may typically take the form of lowering markups. Think Wal-Mart. It sells the same crap you can find in 100 other stores. It’s entire business model is selling it for less than everyone else. With low and falling markups, the contribution of additional inputs like capital (e.g. various IT investments) and labor would not have added to TFP growth.

So consumption TFP could reasonably have flat-lined. I don’t think this represents any kind of glaring flaw in the methodology. But you have to separate the idea of TFP from the idea of “technology”. Once you do that, flat-lining consumption TFP is reasonable.

On top of all that, the idea that consumption technology has not grown much over time isn’t that hard to believe. Consider this example. We just were forced to buy a new fridge because the old one konked out (long, very annoying story). The fridge is produced by the consumer durables sector. Our fridge is more efficient, quieter, colder, etc. etc. than a fridge from 10 years ago. There have been clear technological advances in fridge-making that I benefit from. If I wanted a fridge equivalent to what we had 10 years ago, I could get that for probably 1/4 of the price of the new fridge. So there is obvious technological change going on in the investment sector, and obvious TFP gains.

But I bought the fridge through Best Buy (as it turns out, another long, annoying story). Best Buy’s value-added, such as it was, is part of “consumption” because it is a service. And is Best Buy any better at selling fridges or screwing up delivery dates than they were ten years ago? Maybe, maybe not. If you told me that a major appliance retailer in 1990 was about as efficient at selling and delivering fridges as one today, I’d believe you. What is the major technological breakthrough in the service industry that I should think of from the last few decades? Those little headsets that people at the Gap wear?

Does that mean I shouldn’t care about slow growth in consumption TFP? No. We’d prefer to have faster TFP growth than slower TFP growth. But you shouldn’t dismiss TFP because it doesn’t match up to the notion in your head. If TFP doesn’t pass the “smell test”, it may be that you’re sniffing the wrong thing.